Project management is a complicated process that requires a significant amount of time.
Keeping track of timelines, dependencies, and resources is crucial to ensuring the timely completion of a project within budget. This is where Gantt charts come into play.
If you’re a project manager in Nigeria, you have probably heard of a Gantt chart. But what exactly is it, and why is it so important?
In this article, we’ll discuss what Gantt charts are, how to use them, and the benefits of using them.
Table of Contents
What are Gantt Charts?
A widely-used instrument in project management, the Gantt chart enables project managers to have a clear picture of the project schedule, oversee advancements, and ensure that team members are well-coordinated and oriented.
The idea behind a Gantt chart is to visualise the project timeline and development.
It allows you to see each task’s start and end dates and their dependencies on each other.
The chart helps you understand the project’s progress and identify potential roadblocks or delays.
Interestingly enough, the initial application of Gantt charts was in managing construction projects. But they’ve since been adapted for other industries and projects.
Anatomy of a Gantt Chart
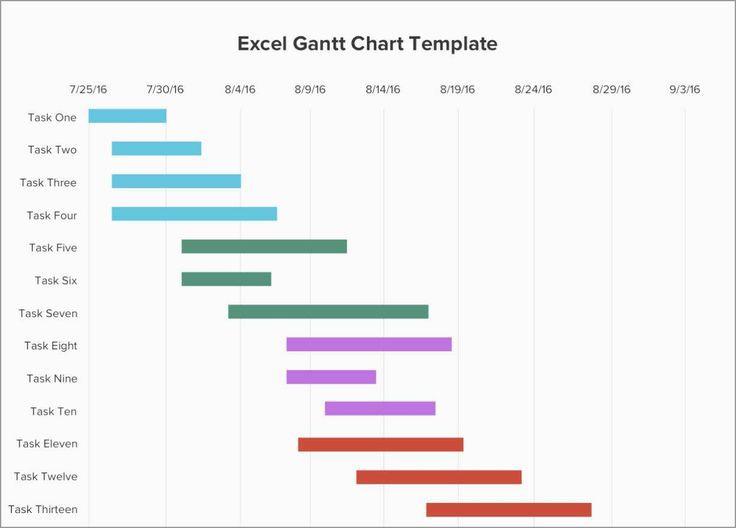
A Gantt chart has a horizontal bar chart and a timeline. The horizontal bars represent project tasks or activities, and their length shows the expected duration of each task.
The timeline typically shows dates, weeks, or months, depending on the project’s timeline.
Tasks are divided into sub-tasks, and represented by shorter horizontal bars under their parent task.
These allow the breakdown of long tasks into smaller, more manageable parts.
Gantt charts can be customised with colours, labels, and other visual aids to improve understanding.
For example, you may use different colours to indicate tasks that are in progress versus tasks that are complete.
Getting Started With Gantt Charts
Working with Gantt charts can be overwhelming, especially if you’re not familiar with the software and tools available.
Here’s an overview of a few Gantt chart tools to help you get started.
-
Microsoft Excel
Microsoft Excel is a well-known spreadsheet program that can be used to create Gantt charts. Excel offers a variety of built-in templates for Gantt charts that you can customize to fit your project needs.
Tasks, deadlines, and progress markers can be added to the chart, and Excel will automatically calculate the timeline for you.
Additionally, Excel allows you to link tasks together, add dependencies, and assign resources.
-
Microsoft project
The Microsoft Project project management tool has Gantt chart functionality which offers more advanced features than Excel, such as resource allocation, cost tracking, and risk management.
It also displays task dependencies, milestones, and deadlines and allows progress tracking and timeline adjustment as needed.
-
Trello
In Trello, tasks and projects are tracked through boards, lists, and cards. While it doesn’t offer traditional Gantt chart functionality, Trello’s calendar view can be used as a simple Gantt chart alternative.
Due dates can be added to cards, and Trello will display them on a calendar. It provides an overview of the timeline of your project and keeps you updated on its progress.
-
Asana
Gantt charts are available in Asana as well. Gantt charts can be created and customised to display task dependencies, deadlines, and milestones. Asana also allows you to track progress and adjust timelines as needed.
Additionally, you can collaborate with team members and assign tasks to specific individuals.
-
TeamGantt
TeamGantt is a project management tool that is specifically designed to focus on Gantt charts and is accessible through a web-based platform.
It offers an intuitive interface for creating and managing Gantt charts, and it’s suitable for businesses of all sizes.
In addition to its specialization in Gantt charts, TeamGantt provides various features such as task management, allocation of resources, and facilitating team collaboration.
-
GanttProject
GanttProject is an open-source desktop application that allows users to create and manage Gantt charts.
It’s suitable for small to medium-sized projects and offers a range of features, including task scheduling, resource allocation, and team collaboration.
-
Monday.com
Monday.com is a cloud-based project management tool that includes a Gantt chart feature.
It allows users to generate and oversee project schedules, monitor progress, and work together with their team members.
Monday.com is a great option for those who need a tool that is highly customizable and can be tailored to their specific needs.
Join our WhatsApp community to participate in our insightful conversations.
Using Gantt Charts Effectively
To create an effective Gantt chart, do the following:
- Define the project scope and list all tasks or work packages.
- Next, identify the dependencies between tasks and note any potential roadblocks or delays.
- Then, assign responsible parties or team members to each task or activity.
- Afterward, you can choose a Gantt chart template or software tool that suits your project needs.
- Update the chart regularly to reflect progress and changes to the project timeline.
Read also: Meeting deadlines: Killer ways to crush ‘rush-hour delivery’ on projects.
How to Create a Gantt Chart For Your Project
Creating a Gantt chart for your project can seem daunting, but it is not necessarily so. Follow these simple steps to create a sample Gantt chart that fits your project needs.
-
Identify your tasks
To begin creating a Gantt chart, it is crucial to first determine the tasks that require completion.
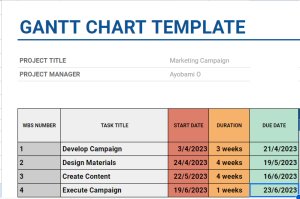
Let’s consider an instance where we are organizing a marketing campaign for the launch of a product. Our tasks could include:
- Develop campaign
- Design materials
- Create content
- Execute campaign
-
Determine the duration of each task
After identifying the tasks, the next step is to determine their duration. This involves figuring out the length of time required to complete each task.
In our example, we’ll assume that the tasks have the following durations:
- Develop campaign: 3 weeks
- Design materials: 4 weeks
- Create content: 4 weeks
- Execute campaign: 1 week
-
Create your gantt chart
With the identification of tasks and their respective durations, it is now possible to create the Gantt chart.
While there are various tools available, we will use Microsoft Excel for this particular example.
- Open a new spreadsheet in Excel.
- Create a table with four columns: Task, Start Date, Duration, and End Date.
- Enter your tasks in the first column.
- In the “Start Date” column, input the specific date that marks the beginning of each task. For our example, we’ll assume that the campaign launch date is April 1, 2023.
- In the “Duration” column, input the number of days that will be required to finish each task.
- In the “End Date” column, a formula should be applied to compute the final date for each task. For example, if the start date for a task is March 26th, 2023, and the duration is 5 days, the end date would be March 30th, 2023.
-
Format your gantt chart
Now that you have created your Gantt chart, you can format it to make it easier to read and understand. Here are some suggestions to enhance the Gantt chart:
- Incorporate colors into the bars to make them more visually appealing.
- Use grid-lines to separate the tasks.
- Adjust the font size to make the chart easier to read.
Here’s what your Gantt chart could look like:

-
Frequently adjust Gantt chart to depict alterations or progress made
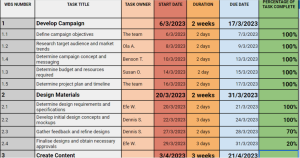
As the project progresses, ensure the regular update of the Gantt chart with any changes such as subtasks, individuals assigned to each task, or progress made.
It will help you stay on track and ensure everyone on the team knows the project’s current status.
Here’s what a Gantt chart with subtasks, individuals assigned, as well as progress report looks like:

Keep in mind that the dates provided are merely samples and can differ depending on the specific project’s requirements and timeline.
When creating a Gantt chart, it is important to take into account the time required for each task and the ones that are reliant on the completion of others before they can commence.
Ensure to allocate adequate time between tasks to account for any unpredicted setbacks or alterations.
Additionally, ensure to remove days when your team does not work, such as weekends, to have a more accurate representation of the project schedule.
Benefits of Using a Gantt Chart
As a project manager in Nigeria, staying on top of project timelines, dependencies, and progress can be too much to handle.
However, using a Gantt chart allows you to visualise the vital aspects of your project and keep your team aligned, organised, and on track.
Using a Gantt chart offers additional advantages, such as;
-
It presents a vivid representation of all tasks
A gantt chart depicts project timelines and interdependencies in a comprehensive visual format
The chart presents a vivid representation of all tasks and their relationships.
It enables you to quickly identify potential roadblocks or delays and adjust your timeline as needed.
-
Keeps project team members organised and aligned
With a Gantt chart, you can ensure that every team member knows what tasks they are responsible for and when to complete them.
It helps to minimise confusion and ensure everyone is working towards the same goals.
Read also: How to become a product manager in Nigeria.
-
Helps to allocate resources more efficiently and effectively
Using a Gantt chart to visualise the timeline and dependencies of a project, project managers can identify areas where resources may be over-allocated or lacking.
It can help them adjust resource allocation to optimise the project workflow and minimise delays or redundancies.
Read also: Agile project management: Why it is good for your business.
-
Helps to identify potential roadblocks
A Gantt chart will enable you to see tasks that are taking longer than expected or when dependencies are falling short.
It allows you to identify potential issues early on and take action to keep your project on track.
-
Tracks progress and keep everyone up-to-date
Gantt charts allow project managers to easily track progress and ensure that all team members are up-to-date on the project status.
It helps everyone to stay on the same page and work collaboratively towards a successful outcome.
-
Improves communication and enhances stakeholder buy-in
With a Gantt chart, you can provide clear and concise updates on project progress to stakeholders, clients, and other team members.
It builds trust and enhances buy-in for your project.
Conclusion
In general, utilising a Gantt chart can assist you in maintaining organisation, concentration, and progress while handling your projects.
It’s a valuable tool that can help you stay on top of your project’s progress from start to finish, save you time and increase your chances of success.
So, if you’re a project manager in Nigeria, start incorporating Gantt charts into your project management strategy. You won’t regret it.
What do you think about this? Share with us in the comments.
So you won’t miss out on our latest valuable posts, subscribe to our newsletter now.
About Author
-
Jemiyotan is a writer, researcher, and instructional designer.
She likes to discover new ideas and explain them in an easy-to-understand way. She enjoys finding the perfect balance between the complex details of her topic and the feelings it can evoke.
When she's not writing, you'll most likely find her exploring the latest trends on social media or binge-watching shows.
Latest entries

 Business InsightsApril 23, 2023A Full Guide to Change Management in a Nigerian Business Environment
 CareerMarch 29, 2023What Is a Gantt Chart? And Why Project Managers Should Use It

